Steve Richards's Rock-n-Roll Politics podcast of 27 March 2026 started with an email from Tom McPhale.1 This post will not take on Tom's opinions, but will present some data and facts that contradict his specific claims. (The extract of the transcript of Tom's mail is in the footnote.2)
CO₂ levels #
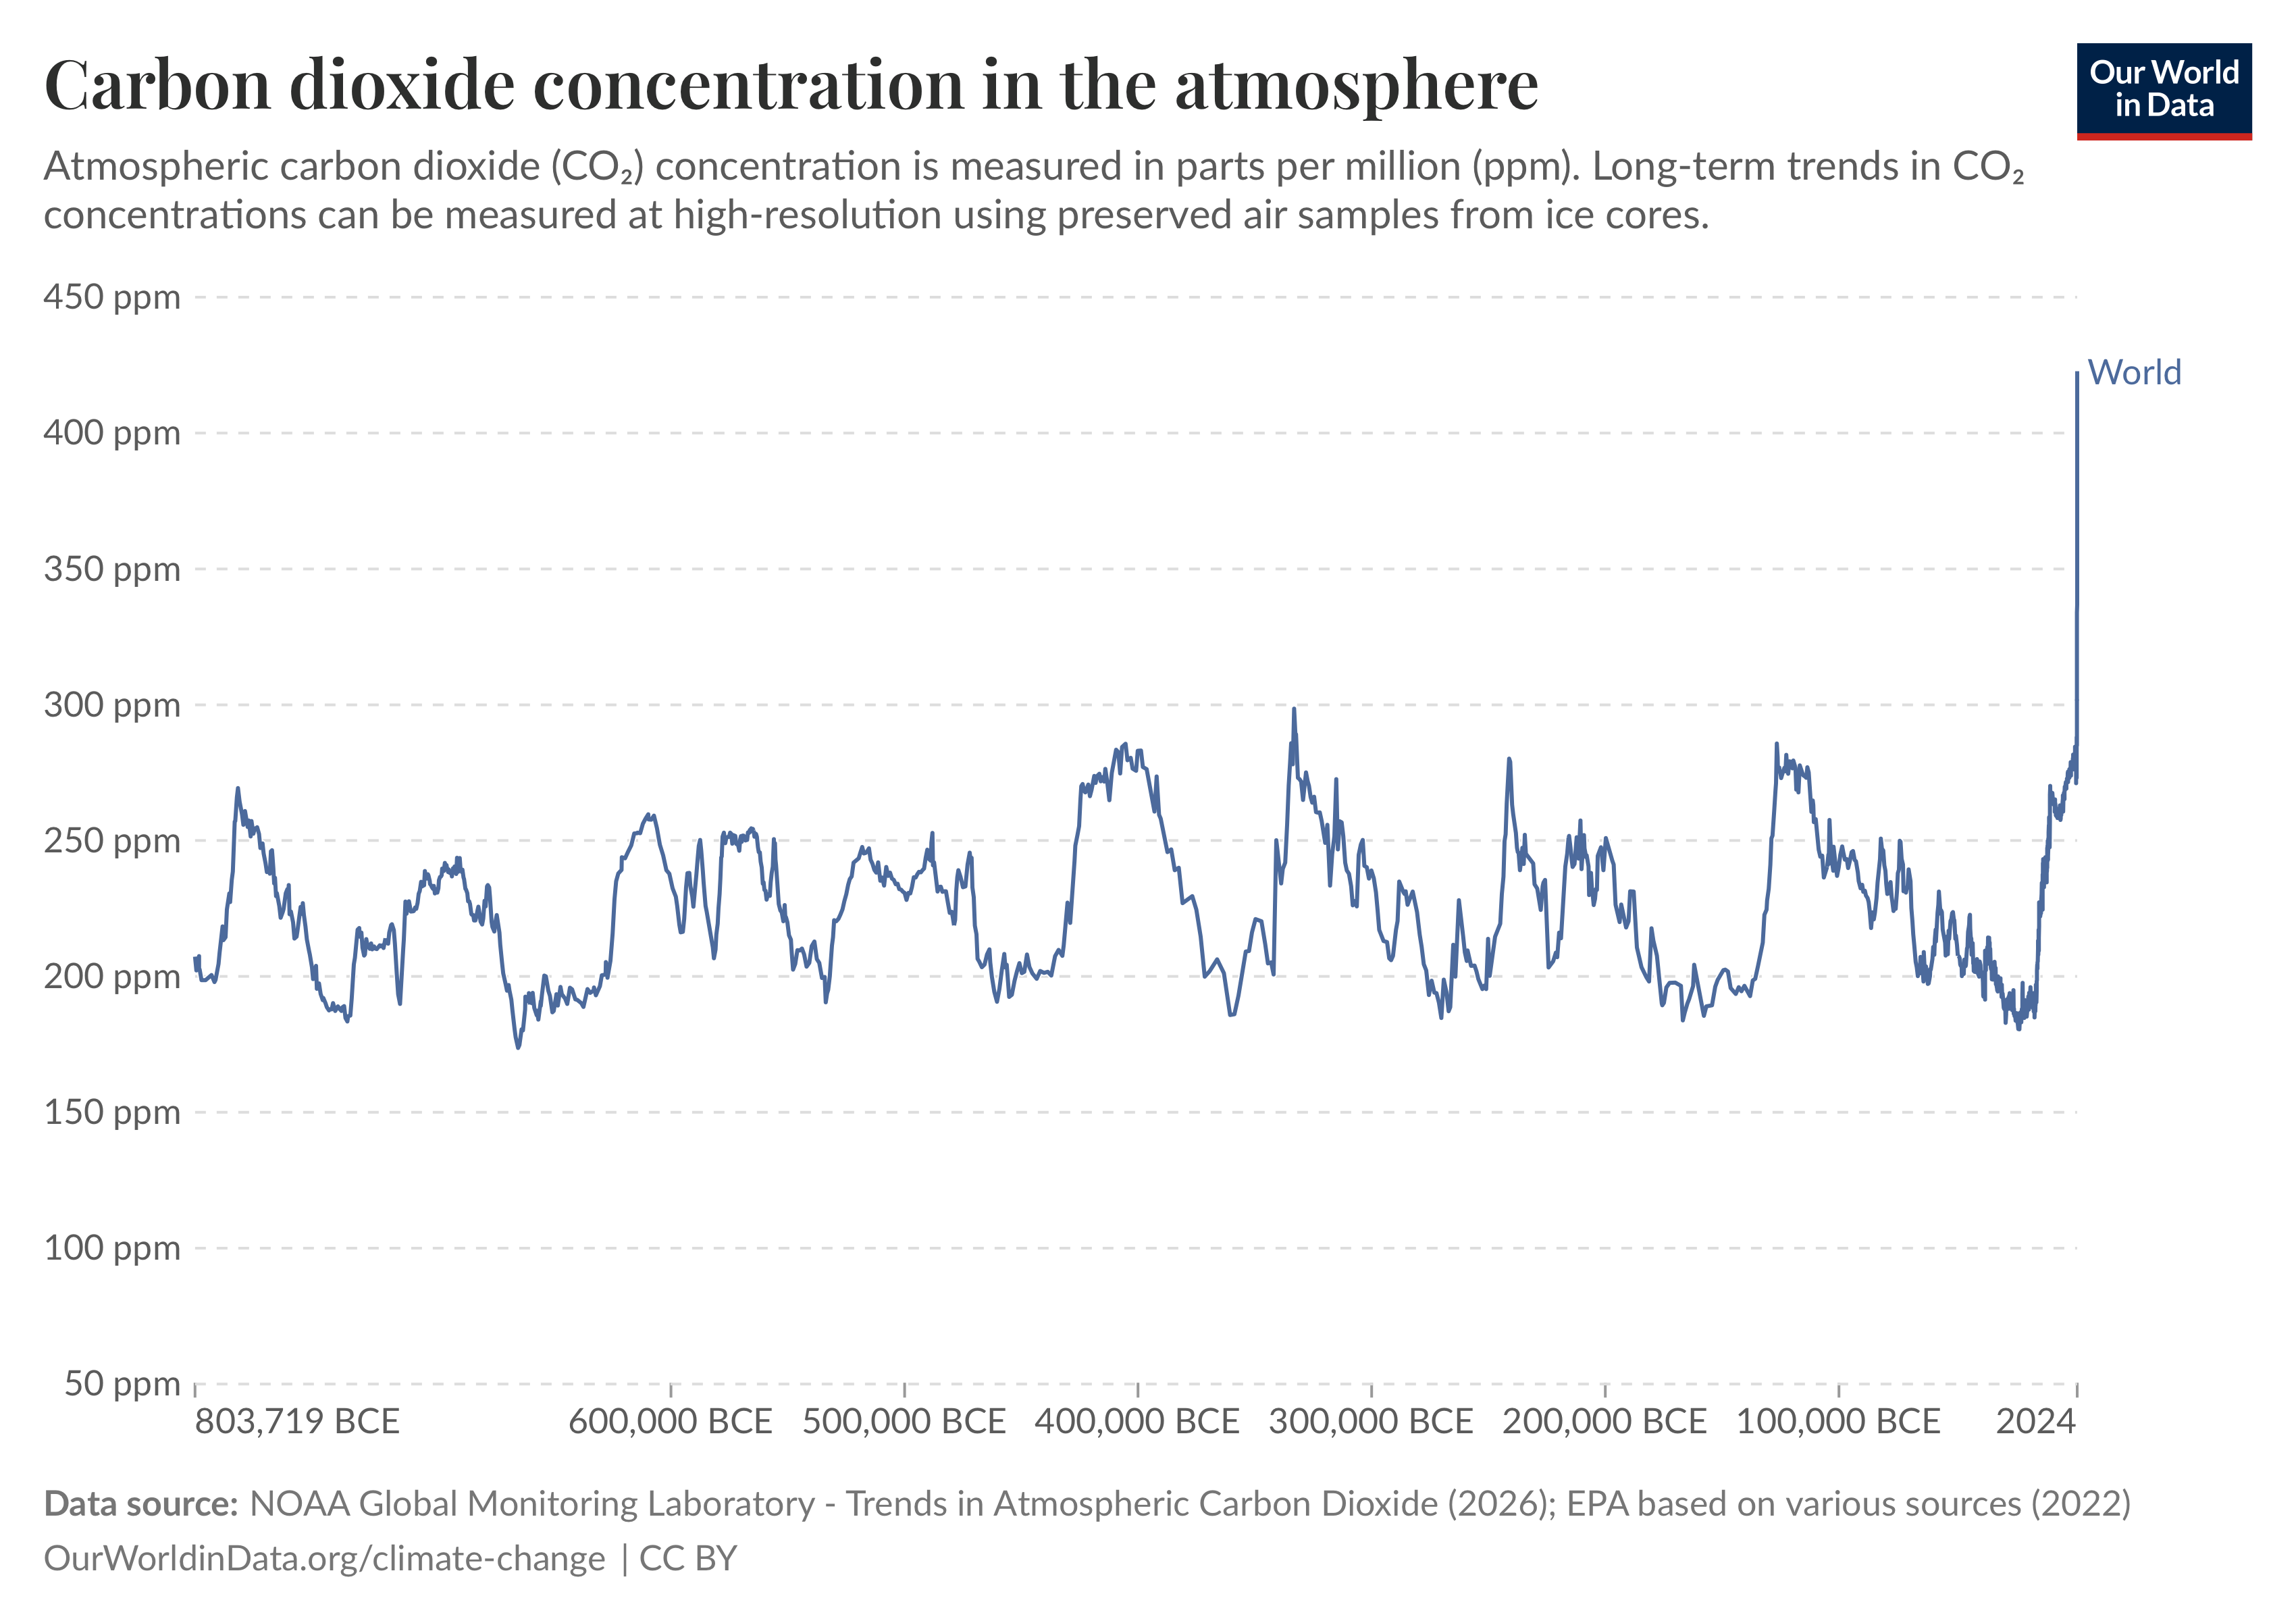
Our World in Data has this graph of atmospheric CO₂ levels over the last 800,000-odd years:
https://ourworldindata.org/grapher/co2-long-term-concentration
This is the 800-thousand-year view:
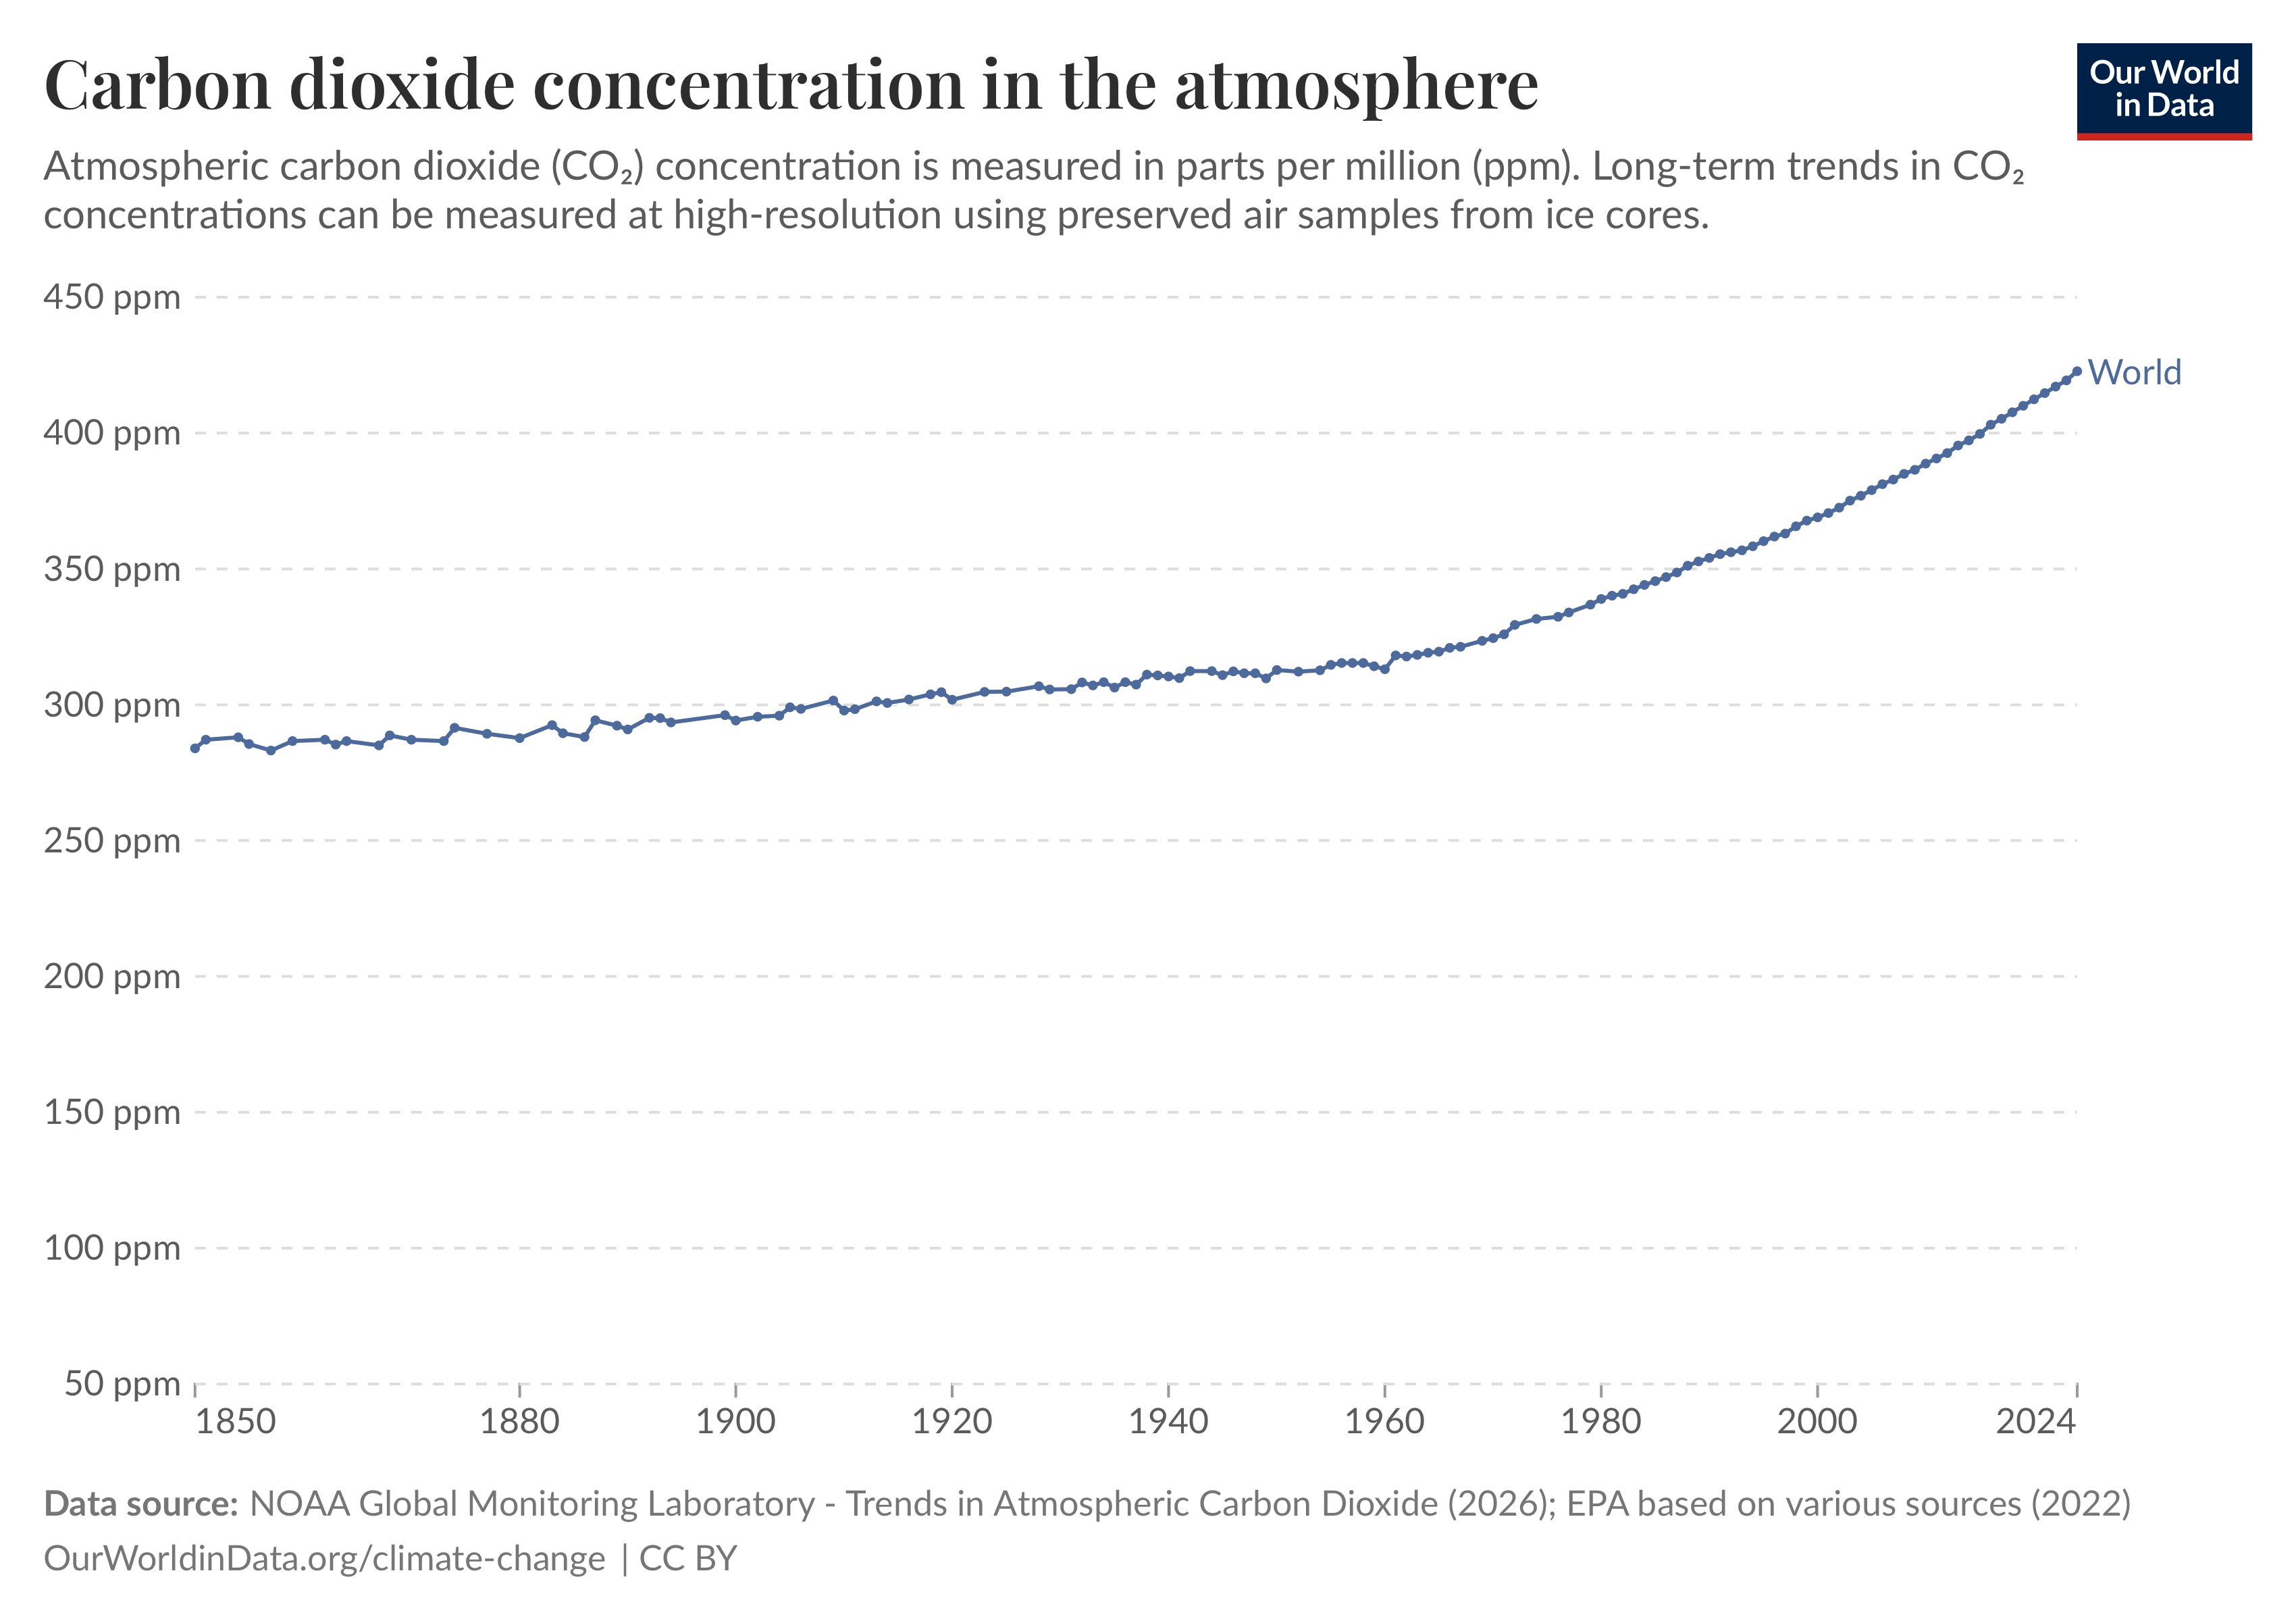
And here is the data since 1850.
- The highest level of CO₂ over before now over the last 800,000 years was 300 parts per million (ppm).
- Preindustrial levels were around 280 parts per million/3
- When I was born, in 1965, they had risen to 320ppm.
- When my son was born in 2000, they had risen to 369ppm.
- Today they are 423ppm (just over 50% higher than pre-industrial levels).
(Don't like Our World in Data? Just do a web search. There are loads of sources of almost identical data.)
Variability #
All climate scientists know that climate is variable. That is accounted for in all the measurements and predictions from the International Panel on Climate Change etc.
The Greenhouse Effect Causality #
The reason physicists and climate scientists are confident climate change is real and anthropogenic is that we understand the simple physics of the atmosphere and how the greenhouse gases lock in heat. We also know all the human activities and practices that add CO2 and more potent greenhouse gases to the atmosphere.
In fact, Shell predicted the climate change effect of fossil fuels perhaps as early as the 1960s, and certainly by the 1970s.4
Temperature Data: Climate Stripes #
Ed Hawkins, University of reading, developed climate stripes to show mean global surface temperature. You can see these since 1850 at:
https://showyourstripes.info/b
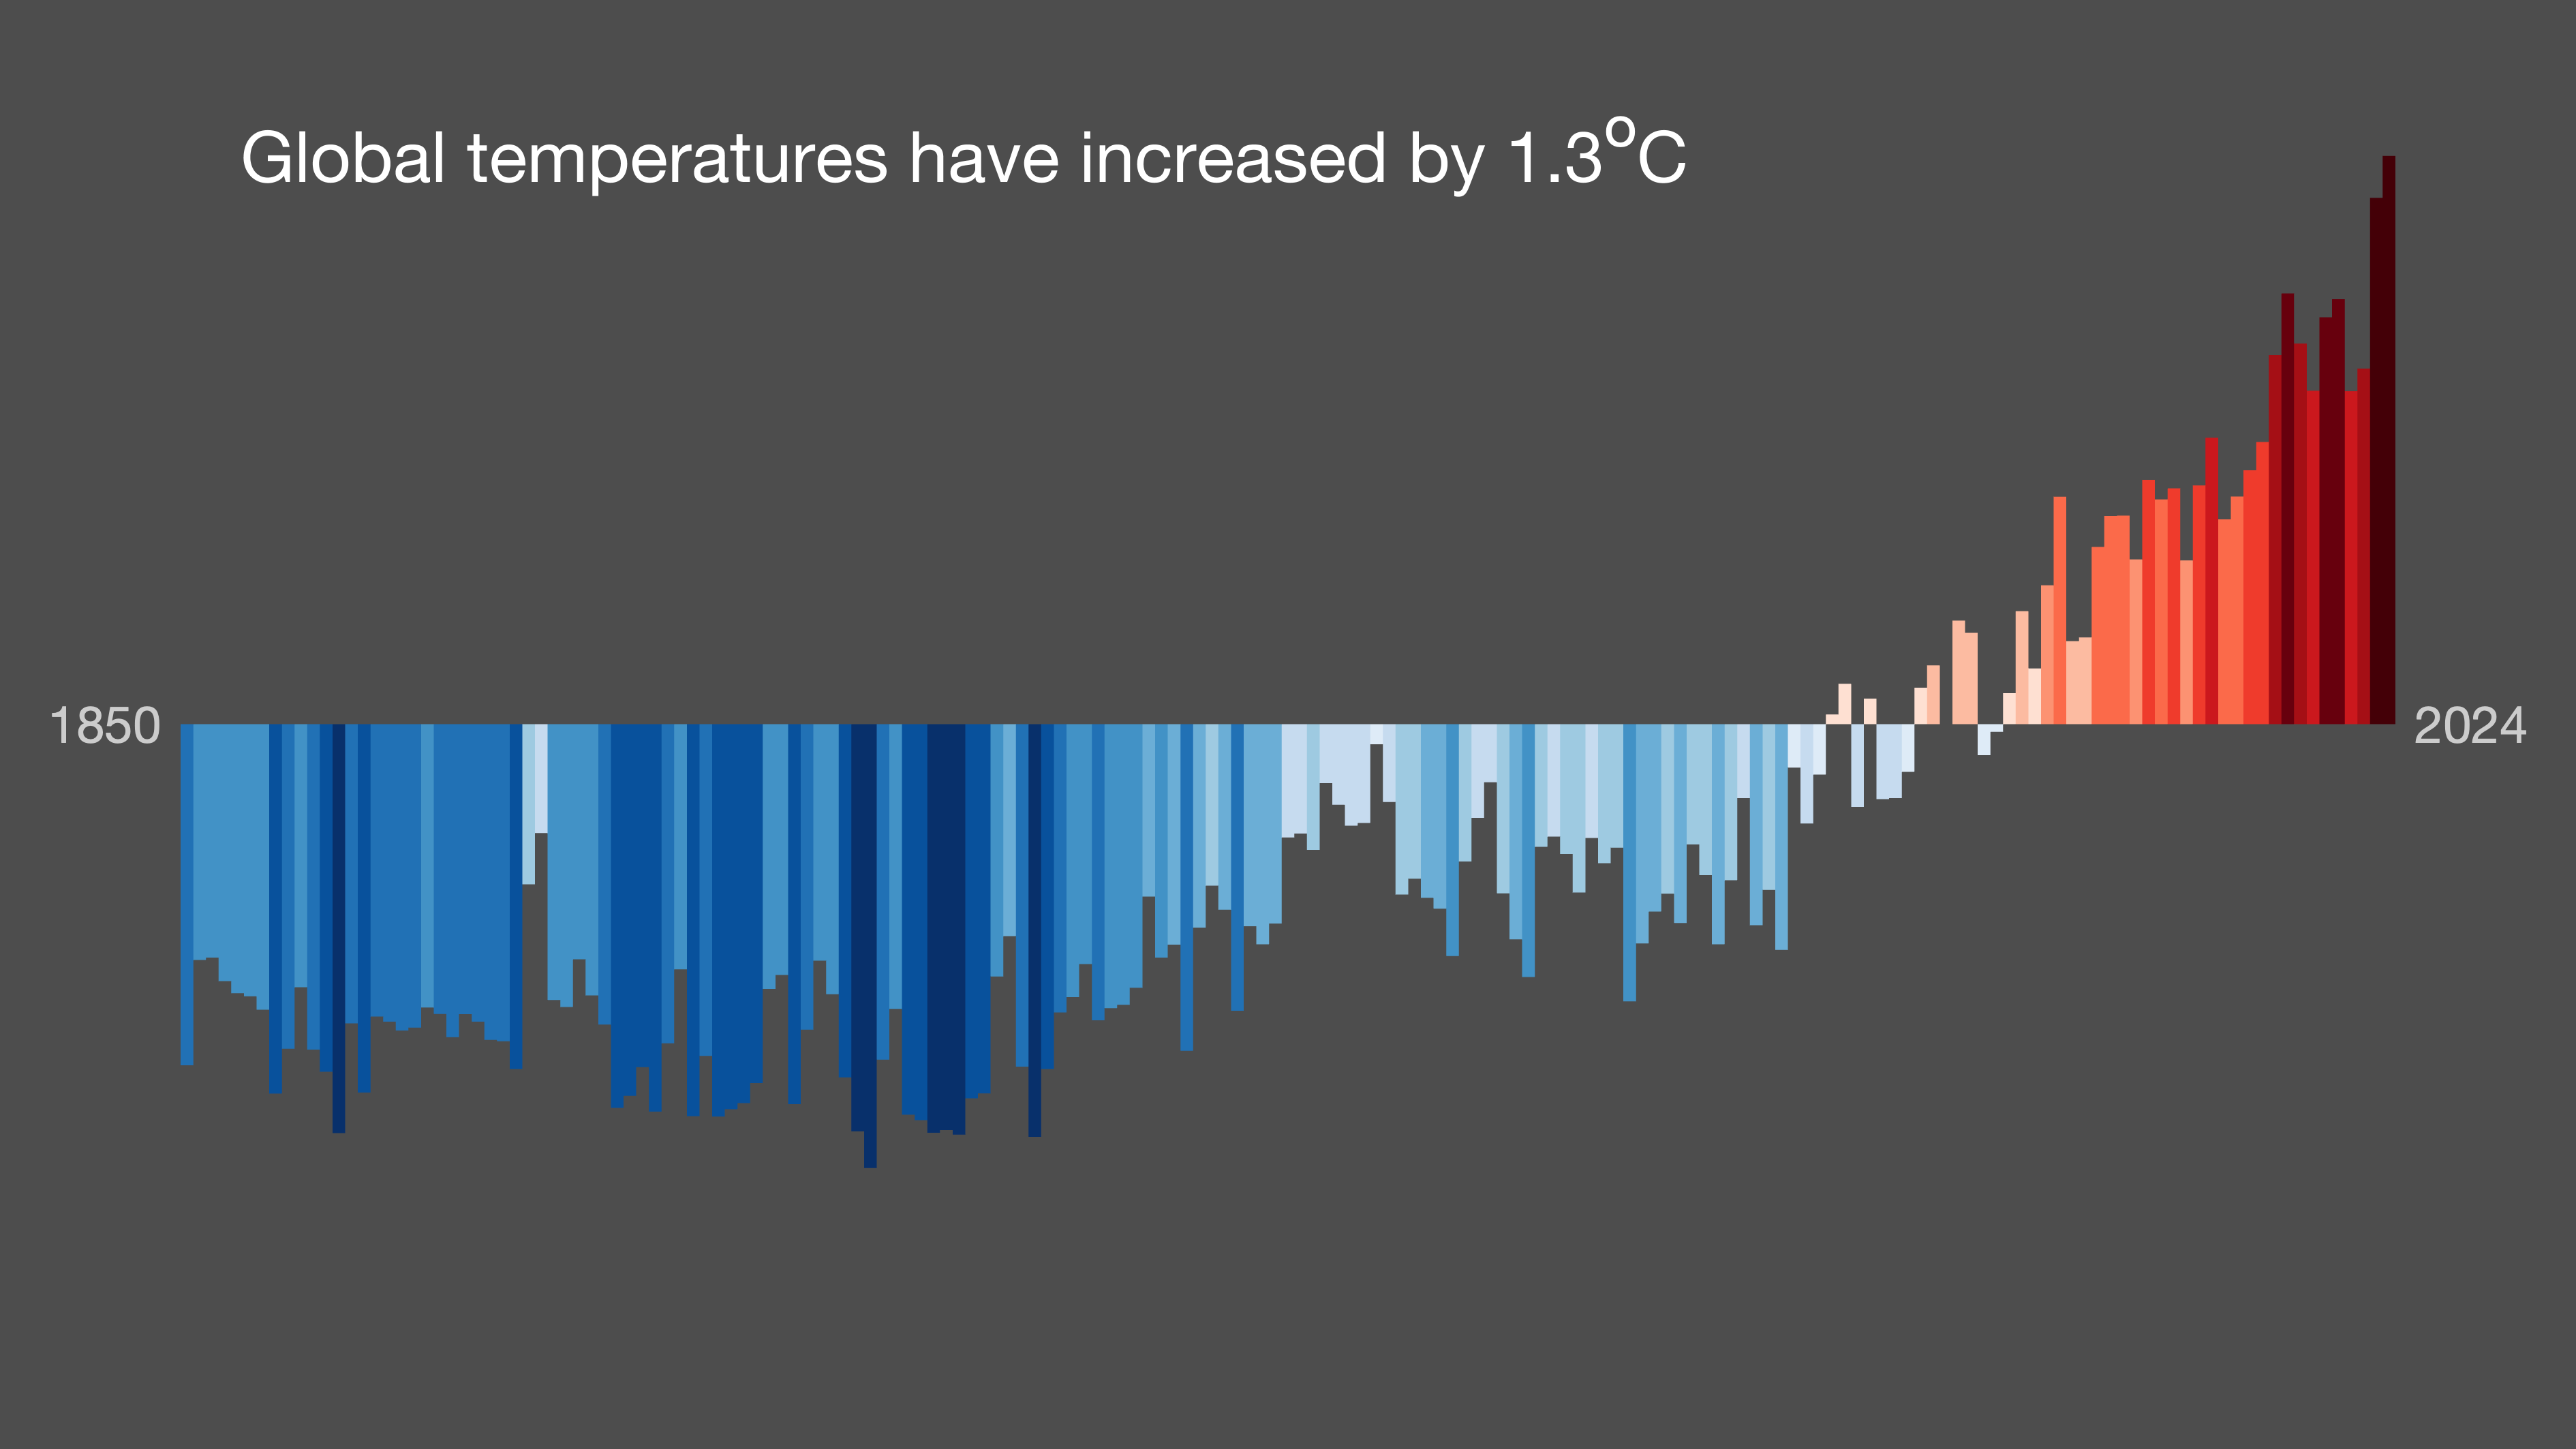
Every year from 2015 to 2024 was hotter than any previous year back to 1850. 2025 isn’t included, but was probably hotter.
Renewables Capability and UK Energy Mix (Electricity Generation) #
This is snapshot of the UK national grid at 16:03 on Saturday 28 March as I type this.
74.4% of generation is renewable.
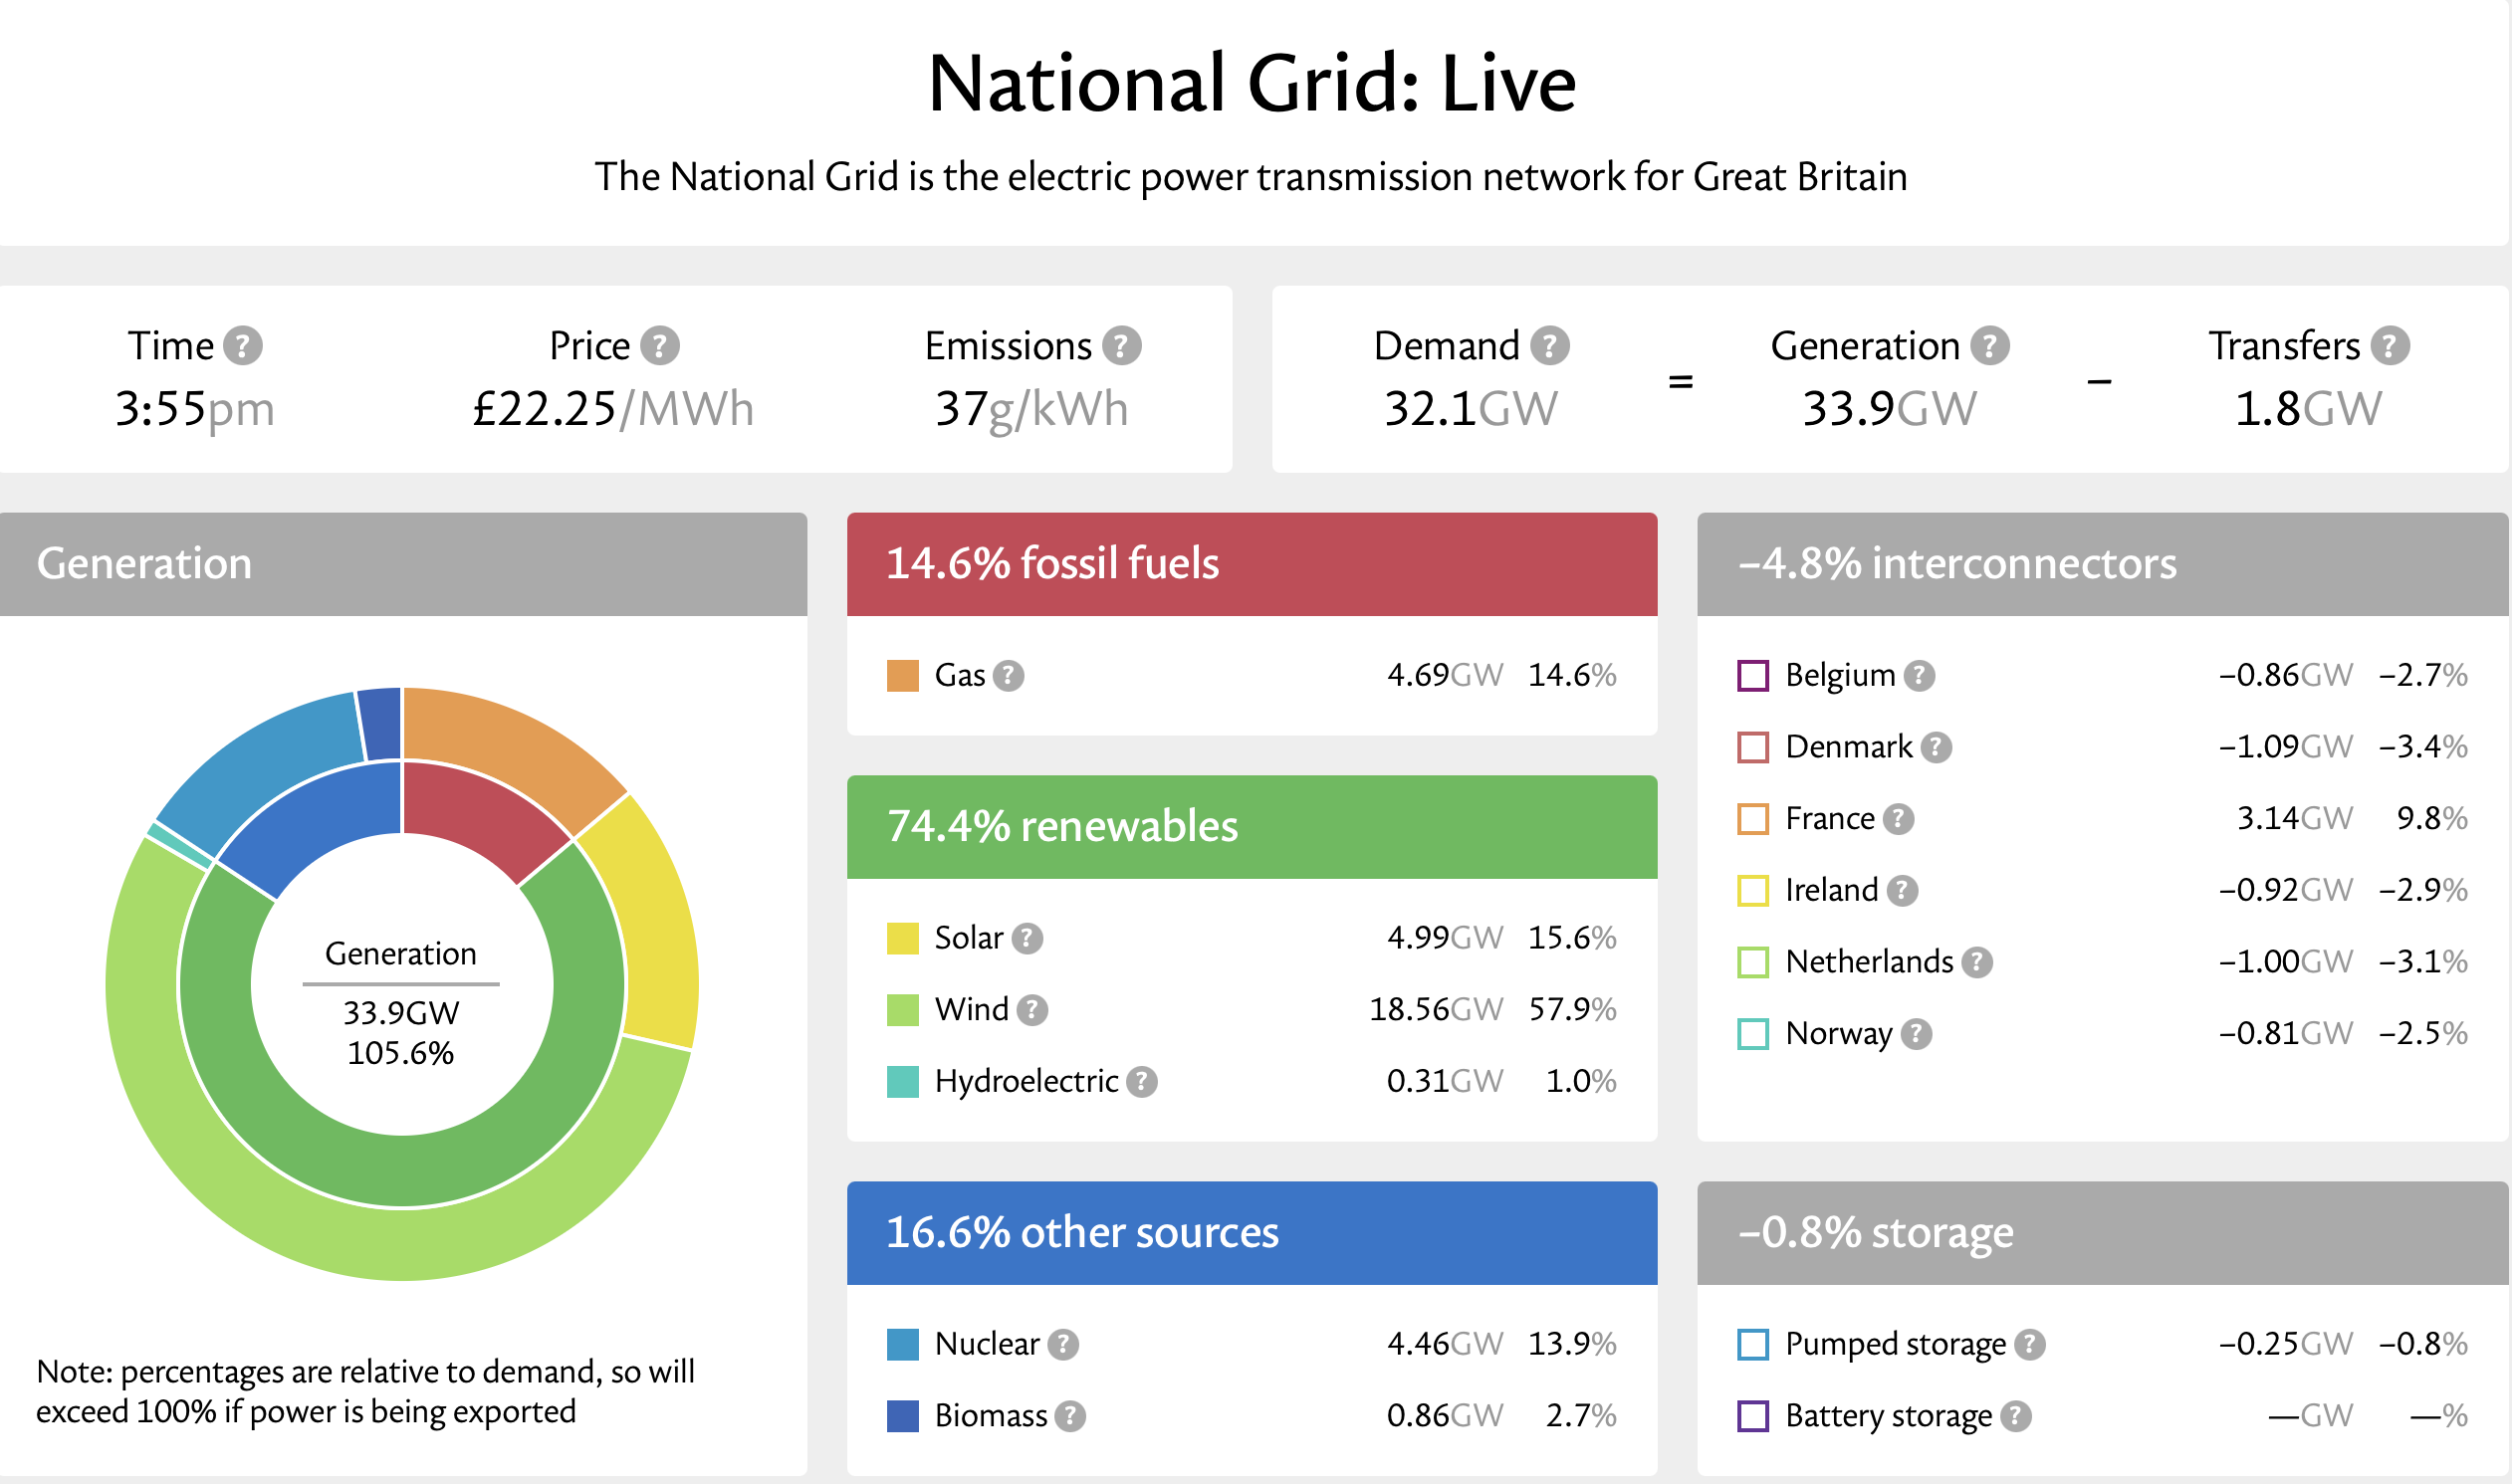
Over the past year, 89.8% of UK generation was renewable.

(Tom said “they only work 10–30% of the time”, but of course, the grid uses a mix and some storage, which is how over 40% supply of the last year is already achieved.)
Electricity Price: Gas and Renewables #
The reason electricity is so expensive in Britain is that the energy price is set by the most expensive supplier of electricity in the UK, which is invariably gas. Here are the first four web links I found explaining this.
- https://www.bbc.co.uk/news/articles/crkep1vx3mro
- https://www.carbonbrief.org/qa-why-does-gas-set-the-price-of-electricity-and-is-there-an-alternative/
- https://www.greeniow.org.uk/why-uk-electricity-prices-are-tied-to-gas/
- https://www.taxresearch.org.uk/Blog/2026/03/17/why-gas-sets-the-price-of-electricity-and-why-the-economics-behind-it-makes-no-sense/
(Don't like these sources: search yourself for information on how the UK electricity price is set.)
Facts are Sacred #
It’s unfortunate that so much of the right has set its face against science and the environment. As C. P. Scott said, “Comments are free but facts are sacred” (Manchester Guardian 5 May 1921; https://www.theguardian.com/sustainability/cp-scott-centenary-essay). At this point, claiming that humans are not causing climate change is as credible as saying smoking doesn’t cause cancer, HIV doesn’t cause AIDS, or the moon landings were faked. The scientific consensus as as nearly perfect as any scientific consensus ever is.
-
I don't know how Tom spells his name; apologies if it's Mac not Mc, or McPhail, McFail or something else. ↩︎
-
“Steve, love your work, a long time listener to the podcast and occasional visitor to Kings Place live. Well, now I’m reading this out, Tom. It’s compulsory. You come every time and you will enjoy it every time. Unlike, I guess, most of your audience, I’m a Conservative Party member.
“We few, we happy few, et cetera. So I thought I’d pitch in on why Ed Miliband is so hated by the right. I don’t know, by the way, Tom, whether I use the word hate.
“I said they were obsessed by him and misrepresented him in various ways. But anyway, back to Tom. We don’t hate Miliband because he’s effective.
“We care about him because he’s effective. We hate him because he combines being profoundly wrong about climate and energy policy with a quite staggering level of hubris about the moral righteousness of his world view. No humility, no room for self-doubt and most importantly, no ability to listen to contrary opinions.
“On the climate, I don’t know for sure the extent to which it may be changing as a result of human activity. What keeps getting lost is that climate is always fluctuating. By historical standards, it’s[…] cold right now, and CO2 levels are close to their low point.
““I can tell you, Tom, some members of the Co-operative are already writing their responses as I continue to read you out. Even on Miliband’s terms, our rush to net zero makes no sense because UK territorial emissions are less than 1% globally, and no one is following our lead. So all we’re doing is offshoring jobs and tax revenue, making ourselves poorer and less energy secure.
“We’re doing zilch for the planet in the process. Then there’s the renewable myth. They aren’t cheap, they aren’t reliable, and they aren’t clean.
“They only work 10% to 30% of the time. They require vastly more interconnectors, backup, grid rebalancing. They need thousands of tons of concrete, rare earth minerals, miles of copper, balsa wood from the Amazon, solar panels made with slave labor, and coal-fired power stations in China.
“I’ll tell you what, Tom, this reminds me of when I’m discussing this issue with Ian Martin on the Not Another One podcast. He takes your view. As you know, I don’t.
“But we’re in a debate, so I’m going to carry on a bit longer. It doesn’t matter how many renewables you have, you still don’t have any power[…] on it goes, we need nuclear, we need lots of small reactors built at low cost, as pioneered by the South Koreans.
“In the meantime, we need hydrocarbons to bridge us across until they’re built. We should be exploring fracking too. God, I can see this triggering all sorts of...
“If people are running while they’re listening to this, Tom, they’ll be breaking all records. Spurred on by disagreeing with you in all of this. Yeah, explore fracking too.
“Ironically, the Greens and the Lib Dems who got confused by the technology differences between nuclear weapons and nuclear power stations have done more harm to the environment by blocking nuclear power stations than any other political movement. So it’s not because Ed Miliband is effective. He’s making us poorer, and he’s so damn pleased with himself while he does it.” ↩︎ -
https://earth.org/data_visualization/a-brief-history-of-co2/ ↩︎
-
https://www.commondreams.org/news/shell-fossil-fuels-climate-1970s ↩︎
-
The site is
iamkate.combecause ‘Kate’ is Kate Morley. She sources the data from the National Energy System Operator Data Portal. ↩︎